Validation
The proposed algorithms are evaluated and demonstrated on gene expression time series data coming from a study examining the global cell-cycle control of gene expression in fission yeast Schizosaccharomyces pombe(1). The study includes 8 independent time-course experiments synchronized respectively by 1) elutriation (three independent biological repeats), 2) cdc25 block-release (two independent biological repeats, of which one in two dye-swapped technical replicates, and one experiment in a sep1 mutant background), 3) a combination of both methods (elutriation and cdc25 block-release as well as elutriation and cdc10 block-release). Thus the following 9 different expression test sets are available: 1) elu1, 2) elu2, 3) elu3, 4) cdc25-1, 5) cdc25-2.1, 6) cdc25-2.2, 7) cdc25-sep1, 8) elu-cdc25-br, 9) elu-cdc10-br. Measurements for each experiment were taken at synchronization time 0 and then every 15 min for up to 315 min. The elutriation datasets and the cdc25 block-release datasets consist of 18 to 20 time points covering 2 full cell cycles, the combined elutriation/block-release datasets contain 21 to 22 time points, however covering only one cycle.
Feature selection through hybrid aggregation
First, the empty rows (genes with no expression measurements) have been filtered out from the nine expression matrices and any other missing expression entries have been imputed with the DTWimpute algorithm(2). Then p-values for regulation have been calculated, performing permutation tests as described in the article of de Lichtenberg et al.(3), i.e. a p-value vector has been associated to each expression matrix. Subsequently, for the set of genes occurring in all 9 experiments, a p-value matrix has been created. This is of dimension 3970 genes times 9 experiments.
The feature selection procedure has been applied to the p-value matrix. For the purpose of the hybrid aggregation procedure, three different aggregation operators have been selected: arithmetic, geometric and harmonic means. Each one of these aggregation operators exhibits certain shortcomings when used individually. For instance, the arithmetic mean values are strongly influenced by the presence of extremely low or extremely high values. This may lead in some cases to an averaged overall p-value, which does not adequately reflect the different individual p-values. In case of the geometric mean, the occurrence of a very low p-value (e.g. 0 or close to 0) in a single experiment for a particular gene is sufficient to produce a low overall p-value for this gene, no matter what the p-values for the rest of the experiments are. The harmonic mean behaves even more extremely in situations when single entries with very low values are present.
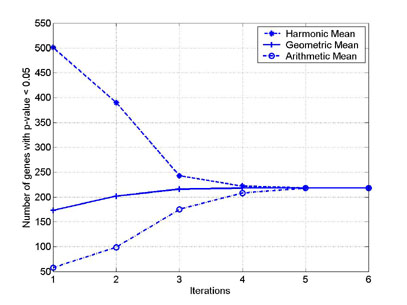
This figure reports the evolution of the number of genes with p-values lower than 0.05 for each of the three individual aggregation operators as the hybrid aggregation algorithm progresses. The initial number of significant genes for threshold 0.05 identified by each of the three operators is very different: while the arithmetic mean identifies merely 58 out of 3970 genes (1.5%), the harmonic mean selects more than 500 significant genes (12.6%). The geometric mean is more moderate in producing 173 significant genes (4.4%). The hybrid aggregation process has converged after a couple of iterations resulting in 218 significant (with p-values lower than 0.05) genes (5.5%) in total.
Data fusion through hierarchical pairwise alignment and merge
The expression profiles of the 218 significantly regulated genes, identified for threshold 0.05, have been extracted from the complete expression matrices for each of the 9 experiments. Then the 9 different expression matrices, consisting of 218 genes and a varying number of time points (ranging from 18 to 22), have been fused in 8 steps (see Data fusion).
| experiments | 1 |
2 |
3 |
4 |
5 |
6 |
7 |
8 |
9 |
| 1) elu1 | - |
||||||||
| 2) elu2 | 7.6 |
- |
|||||||
| 3) elu3 | 7.6 |
8.3 |
- |
||||||
| 4) cdc25-1 | 8.3 |
8.1 |
8.4 |
- |
|||||
| 5) cdc25-2.1 | 9.5 |
8.5 |
9.4 |
7.2 |
- |
||||
| 6) cdc25-2.2 | 9.4 |
8.4 |
9.5 |
6.9 |
5.0 |
- |
|||
| 7) cdc25-sep1 | 8.6 |
8.4 |
8.8 |
5.9 |
7.2 |
7.1 |
- |
||
| 8) elu-cdc10-br | 9.8 |
9.3 |
9.9 |
9.5 |
8.9 |
9.0 |
9.8 |
- |
|
| 9) elu-cdc25-br | 9.7 |
9.3 |
9.5 |
10.3 |
9.3 |
9.4 |
10.2 |
6.0 |
- |
Each iteration of the data fusion procedure consists of three distinctive steps: pairwise alignment, optimal order and pairwise merge. The DTW distance(4) matrix created at the pairwise alignment step during the very first iteration of the fusion algorithm is given in the above table. These distances have been used at the next step in order to determine the optimal sequence in which the different expression matrices would subsequently be merged. This optimal sequence is as follows: 9) elu-cdc25-br, 8) elu-cdc10-br, 5) cdc25-2.1, 6) cdc25-2.2, 4) cdc25-1, 7) cdc25-sep1, 2) elu2, 1) elu1, 3) elu3, and the DTW distances corresponding to it are marked in red. After the completion of the first data fusion iteration, 8 new expression matrices have been created. These have been subjected again to pairwise DTW alignment, optimal (re-)ordering and merge. At each iteration step the expression profiles have gradually been getting closer, in terms of DTW distance, to each other. Thus in the course of 8 iterations, the originally available 9 different expression matrices have smoothly been fused into a single expression matrix of the 218 genes in 25 fused time points.
The fused expression profiles can be used for the detection of periodic behavior. For instance, the above figure depicts for 3 different genes the fused expression profiles (solid thick line) on the background of the 9 original expression profiles (dashed thin line) for each gene. These genes have been selected since they have some known cell cycle involvement, as for instance cdc22 is involved in S-phase regulation, hht1 is a histone and TF2-7 is a TF2-type transposon. The first two plots, are examples of clear periodic behavior expressed over all the experiments and consequently, the fused profiles are periodic with two distinctive well formed cycles. Two separate cycles can be identified also for the fused expression profile in the third plot. However these are much less pronounced than the rest two since the underlying original expression profiles exhibit some peak shift and a difference in a peak amplitude.
| cluster center | associated genes in order of closeness |
| hht1 | hht2, hht3, hta1, hhf3, htb1, hta2 |
| TF2-7 | SPCC794.05C, TF2-5, TF2-8, TF2-2, SPBC1E8.04C, TF2-1, TF2-6, TF2-10 |
| cdc22 | SPAP14E8.02, rpc17, SPBC3E7.12c, cdt2, SPAC17H9.18c, SPAC23A1.01c, mid2, ace2, cdc18, mik1, SPBC1709.12, SPBC21B10.13c |
Some of the fused expression profiles have a very distinctive shape and can be used as a sort of gene signature for a particular activity, e.g. cyclic behavior, stress response, noise, etc. For instance, the above table contains the complete lists of 3 gene clusters: hht1, TF2-7 and cdc22. The clusters have been obtained by aligning, using the DTW algorithm, the fused profile of each one of the three genes against the rest of the fused expression profiles. The genes with the best matching profiles have been selected as associated to the the gene in question.
(1) Rustici,G., Mata, J., Kivinen, K., Lio, P., Penkett, C. J., Burns, G., Hayles, J., Brazma, A., Nurse, P., Bähler, J. Periodic gene expression program of the fission yeast cell cycle, Nature Genetics, 36 (2004) 809-817.
(2) Tsiporkova,E. and Boeva,V. Two-pass imputation algorithm for missing value estimation in gene expression time series. Journal of Bioinformatics and Computational Biology, 5 5 (October 2007) 1005-1022.
(3) de Lichtenberg, U., Jensen, L.J., Fausbøll, A., Jensen, T.S., Bork, P., Brunak, S. Comparison of computational methods for the identification of cell cycle-regulated genes. Bioinformatics 21 7 (2004) 1164-1171.
(4) Sakoe,H. and Chiba,S. Dynamic programming algorithm optimization for spoken word recognition, IEEE Trans. on Acoust., Speech, and Signal Process, ASSP-26 (1978) 43-49.